
Use dashboarding and KPIs to uncover spending trends, improve procurement performance, and enable data-driven decisions across the boardroom.
Data becomes steering
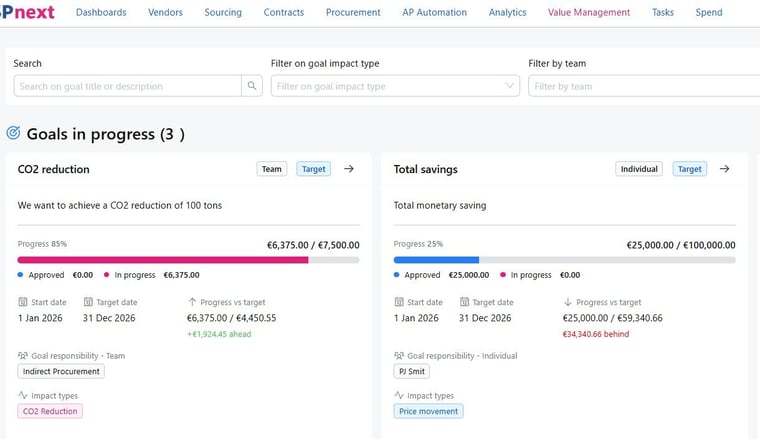
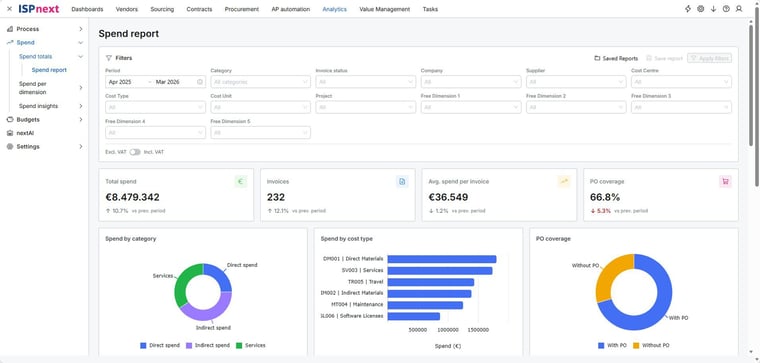
A dashboard turns spend data into something you can act on.
Trends visible
Shifts in spend and suppliers stand out earlier.
Ready for the boardroom
Reporting becomes available in real time instead of per quarter.
Organisations generate vast amounts of spend data, yet turning that data into actionable insight remains a challenge. Especially within finance and procurement, decision-makers need clarity, consistency and confidence in their numbers. Dashboarding and KPIs bridge the gap between raw data and strategy, enabling organisations to move from reactive reporting to proactive control.
“Data only becomes valuable when it informs decisions,” says Dirk Jan. “Dashboarding helps organisations focus on what really matters instead of drowning in numbers.”
Within Source-to-Pay, dashboards play a critical role in aligning operational activity with strategic objectives.
What is dashboarding in Source-to-Pay?
Dashboarding in Source-to-Pay refers to the visual consolidation of financial, procurement and contract data into a single, real-time overview. Rather than relying on fragmented reports, dashboarding provides continuous insight into spend, performance and risk.
According to Dirk Jan, this integrated view is essential. “When finance and procurement look at the same data, conversations become more constructive and decisions more effective.” By covering the entire procure-to-pay process, dashboarding enables organisations to manage spend with greater confidence.
Spend Dashboarding & KPIs for CPO
Fill in your details and receive the white paper "Get the most out of your procurement strategy with KPIs and dashboards" directly in your inbox. Optimise your processes and make data-driven decisions.
Why KPI dashboards drive procurement performance
Procurement is increasingly expected to demonstrate measurable impact. However, without clear metrics, procurement performance can be difficult to quantify. A well-designed KPI dashboard translates strategic goals into concrete performance indicators.
“Without KPIs, procurement value remains largely invisible,” Dirk Jan notes. “A KPI dashboard turns contribution into something you can actually measure and discuss.” Metrics such as savings, compliance and supplier performance help teams continuously improve and clearly demonstrate value.
Dashboard software as a key to data-driven decision making
Relying on intuition alone is no longer sufficient. Dashboard software enables data-driven decision making by providing real-time insights that are accessible across roles and departments.
“The real power of dashboard software lies in alignment,” explains Dirk Jan. “It ensures everyone bases decisions on the same facts, not assumptions.” By connecting data across functions, organisations reduce friction and accelerate decision-making.
Spotting spending trends for better boardroom reporting
Single data points provide limited insight without context. Spending trends show how costs evolve over time and where structural changes emerge. When visualised effectively, they significantly improve boardroom reporting.
“Trends tell you where the organisation is heading, not just where it has been,” says Dirk Jan. “That perspective is essential in the boardroom.” Executives gain forward-looking insight that supports strategic discussions and long-term planning.
“With smart dashboards, you turn data into valuable insights and drive targeted success within Source-to-Pay.”
 Dirk Jan LeppersProduct Manager | ISPnext
How CFOs use analytics to shape financial strategy
For CFOs, analytics have become a cornerstone of strategic leadership. CFO analytics, supported by a KPI dashboard, offer continuous visibility into financial performance, risks and opportunities.
“CFOsneed more than static reports,” Dirk Jan observes. “They need analytics that allow them to anticipate change and steer the organisation accordingly.” Real-time dashboards enable faster responses and more confident strategic decisions.
How ISPnext supports smarter spend management decisions
ISPnext supports organisations in making smarter decisions within Source-to-Pay by delivering role-based dashboards aligned with strategic objectives.
“Our goal is not to overwhelm users with data,” says Dirk Jan. “We design dashboards that provide direction and support better decisions.” By integrating procurement, finance and contract data, ISPnext creates a single source of truth for spend visibility and control.
Frequently asked questions
Dashboarding provides procurement teams with real-time visibility into performance, compliance and spend. “When procurement has immediate insight, it can act proactively instead of reactively,” says Dirk Jan. This directly supports stronger procurement performance.
A KPI dashboard strengthens boardroom reporting by offering reliable, up-to-date insights. “Boards need clarity, not complexity,” Dirk Jan explains. KPI dashboards ensure strategic discussions are grounded in facts rather than assumptions.
Spending trends reveal long-term patterns in costs and supplier dependencies. “Trends help procurement make choices based on direction, not coincidence,” Dirk Jan notes, supporting more effective data-driven decision making.
Dashboard software enables advanced CFO analytics through real-time and interactive insights. “It gives CFOs the agility they need in a constantly changing environment,” says Dirk Jan.
Effective data-driven decision making requires clear KPIs, consistent data and shared ownership. “A KPI dashboard only adds value when people trust and use it,” Dirk Jan emphasises.
ISPnext improves spend visibility by consolidating data across the entire Source-to-Pay lifecycle. “Visibility is the first step towards control,” Dirk Jan concludes.